Anemia, Iron Deficiency and Diet Independently Influence Growth Patterns of School Aged Children in South Africa-Juniper Publishers
Juniper Publishers-Journal of Pediatrics
Abstract
Objective: To determine the
differences that exist in the growth indicators of primary school-aged
children and to estimate the burden of disease attributed to anaemia,
iron deficiency and lack of dietary diversity.
Design: This cross-sectional
study assessed growth status by determining anthropometric indicators
and motor development. Information on dietary diversity and eating
patterns was collected based on meals consumed at home and at school.
Laboratory assays were conducted on venous blood samples to assess
haemoglobin levels and body iron status.
Setting: Children were recruited from a disadvantaged community in Kwazulu-Natal, South Africa.
Subjects: A study population of 184 children aged six to eight years was enrolled.
Results:The stunting prevalence
was 8.3% for boys and 6.6% for girls. Stunted growth was significantly
associated with prevalence of parasitic infection (17.7%) (p=0.01) and
prevalence of anaemia (23.4%) (p=0.03). A low prevalence of motor
development impairments was found. Anaemia and iron deficiency were
significantly related with impaired fine motor skills (P>0.05). The
diets of 46.7% of the study population met the definition of minimum
dietary diversity. Occurrence of nutritional deficiencies in children
with low dietary diversity was twice as high as in children with
adequate dietary diversity. A significant relationship was noted between
low dietary diversity (seven-day recall) and anaemia (p=0.004).
Conclusion:These findings provide
evidence of the relevance of anaemia and dietary diversity to childhood
growth, reinforcing the importance of effective actions to optimize
children’s dietary intake to achieve better health outcomes.
Keywords: IDEA: Individuals
with Disabilities Act; LRE: Least Restrictive Environment; VCSSO:
Ventura County Superintendent of Schools Office; CARS: Childhood Autism
Rating Scale; IEP: Individualized Education Plan; SEEC: Social-Emotional
Early Childhood; WMS: Walker-McConnell Scale; UCSB: University of
California; Santa Barbara; UCLA: University of California, Los AngelesAbbreviations:IDA: Iron Deficiency Anemia; ID: Iron Deficiency; NIDA: Non-Iron Deficiency Anemia; SANHANES: SA: South Africa; HAZ: Height-for-Age Z-scores; WAZ: Weight-for-Age Z-scores; BAZ: BMI-for-Age Z-scores; DDS: Dietary Diversity Score; SD: Standard Deviation; NSNP:National School Nutrition Program; Hb: Hemoglobin level; CRP: C-reactive protein; SF: Serum Ferritin; s TfR: soluble Trans ferric Receptor; IDS: Iron Deficient Stores; MA: Mixed Anemia; NA: Non-Anemic
Introduction
Nutrition is a key factor in the control of many
diseases of public health significance. In early childhood, iron
deficiency is the most prevalent nutritional disorder [1]. Iron
deficiency anaemia (IDA) in preschool children from the developing world
has been estimated at 56% [1] and in South Africa (SA) this is seen
more commonly in children from particular ethnic groups, namely African
and Coloured, as well as children disadvantaged by poor socioeconomic
circumstances [2]. The 2013 SANHANES-1 report described a declining
anaemia trend of 10.5% and iron deficiency of 8.1% among South African
children aged up to 14 years [3]. Among SA children aged less than five
years 12% are estimated
to be underweight, and 25% stunted [4]. The natural history of
nutritional deficiencies associated with anaemia, such as iron
deficiency in young children is not yet well defined. The high
prevalence of growth deviations and the adverse developmental outcomes
associated with malnutrition and anaemia highlight the need for
prioritization of nutrition programs. The association between anaemia
and psychomotor development has been described by various researchers
with evidence suggesting that despite treatment the adverse consequences
may not be fully reversible [5,6]. This study was an ancillary
exploration to the A sense study which described high levels of anaemia
prevalence (53%)[7]observed during their baseline measurements.
Nutritional status is assessed by measuring clinical health
status, dietary adequacy, anthropometric and biochemical
indicators. These measurements are essential for health screening
and for monitoring the response to interventions. Population
level growth monitoring is valuable for evaluating group nutrition
status within the community as well as for identifying the
determinants and burden of disease attributable to malnutrition.
Our study describes the variations in nutritional status of schoolaged
children living in a rural community and explores the
relation to anaemia and iron status. This study also describes the
contribution of family meals and the school nutritional program to
nutritional status and dietary adequacy. The information obtained
from this study can contribute to addressing the nutrition-related
problems existing in this school-age population and for planning
interventions aimed at overcoming these challenges.
Materials and methods
Growth analyses
Anthropometry measurements were conducted by trained
research nurses. Under-nutrition in childhood is characterized
by growth failure. Height and weight measurements were
used as indicators of nutritional status [8]. Height and weight
were measured according to standard procedures [9]. Weight
measurements were read to the nearest 0.1kg on a portable
Philips® digital bathroom scale - model HF340/00. Body height
measurements were read to the nearest 0.1cm using a Scales®
2000 moveable stadio meter. Height-for-Age, Weight-for-Age and
BMI-for-Age Z-scores for each child were computed using the
WHO Child Growth Standards [10]. Anthropometric indices were
expressed in the form of z-scores; Height-for-Age Z-scores (HAZ),
Weight-for-Age Z-scores (WAZ) and BMI-for-Age Z-scores (BAZ).
Underweight was defined as below minus two standard deviations
(SD) from the median weight for age of the reference population,
while severe underweight was defined as below -3 SD from the
median weight-for-age of the reference population. A deficit in
height (stunting) was defined as below -2 SD from median heightfor-
age of the reference population and severe stunting as <-3 SD.
A deficit in weight-for-height (wasting) was defined as less than -2
SD from the median weight for height, of the reference population,
while severe wasting was defined as < -3 SD [10]. BMI-for-Age
Z-scores >1 SD were categorized as overweight, >2 SD as obesity
while children with BMI values in the range 0 - 1 SD were at risk of
becoming overweight [11].
Motor development was evaluated by a medical doctor who
carried out a gross motor skills’ examination and a fine motor skills’
examination. Motor abilities were characterised into 3 groups:
Locomotor, Body manipulation and Object control. Abilities were
recorded on a log with a pass or fail mark. Each individual’s overall
assessment was then categorised as normal, suspect or delayed.
Dietary intake assessment
Home diet: Two structured questionnaires were used to
describe intake patterns and dietary diversity of food consumed
at home; a non-quantified 24-hour-recall and a 7-day-recall. Both questionnaires were assessed for content validity by a
professional nutritionist, familiar with locally available foods,
and for face validity in a pilot sample of 10 community members.
The questionnaires were interviewer administered by trained
research nurses, to the children’s caregivers. For the 24 hour-recall,
caregivers were asked to recall all foods and beverages consumed
by the children in the previous 24 hours, starting with the most
recent meal and working backwards. Additional information on
dietary diversity was obtained from a seven-day recall of foods
consumed in the preceding week. Each food was assigned to one
of 9 food groups used to evaluate the diet quality index: 1. Cereal,
White roots and tubers; 2. Vitamin A rich vegetables and fruit; 3.
other vegetables; 4. other fruits; 5. Meats; 6. Eggs; 7. Legumes,
nuts and seeds; 8. Milk and milk products; 9. Oils and fats; and
sweets. A dietary diversity score (DDS) was calculated by adding
the total number of different food groups consumed. A DDS < 4
was a reflection of poor dietary diversity [12].
School diet: Study participants were enrolled at eight local
schools that provided a meal within the National School Nutrition
Program (NSNP) and therefore, to obtain a complete picture of
their daily food intake necessitated the collection of information
about meals consumed at home and at school. To obtain insight into
the food consumed at each school, 20 randomly selected children
were discretely observed during a meal. Meals were described in
terms of foods offered, ingredient availability as well as the served
versus consumed portion per child. The information collected was
related to program guidelines and recommendations.
Anaemia analysis: Venous blood samples were analysed
at an accredited local laboratory. Tests for haemoglobin level
(Hb), C-reactive protein (CRP), serum ferritin (SF) and soluble
transferrin receptor (s TfR) were conducted to assess anaemia and
iron status. The body iron assessment was based on the ratio of
sTfR to SF as defined by Cook et al. in the equation: body iron (mg/
kg) = - [log10 (sTfR * 1000/SF) -2.8229)]/0.1207). The limits for
the outcome measures were: (a) anaemia: Hb<11.5g/dl [13] (b)
ID: body iron stores <0mg/kg [14]; and (c) inflammation: CRP≥5
[15]. The children were categorized into five groups based on
anaemia and iron status; iron deficiency anaemia (IDA) - anaemia
and low body iron stores; non-iron deficiency anaemia (NIDA) -
anaemia in the presence of inflammation in a child with normal
body iron stores; iron deficient stores (IDS) - depleted iron stores
in a non-anaemic child; mixed anaemia (MA) for participants with
anaemia in the presence of both iron deficiency and inflammation
and non-anaemic non-iron deficient (NA) – where the child had
normal haemoglobin concentration and normal iron status. Stool
and urine samples were also collected and sent to a local academic
laboratory for microscopy and analysis for parasites.
Statistical considerations: Data were entered daily into a
predesigned electronic database using SPSS version 22 software
package and cleaned regularly. The differentiation between
genders was conducted for anthropometric outcomes, because
of expected differences between boys and girls. Z-scores and
standard deviations (SD) were used as reference standards indicating deviation from the mean. WHO anthropometric tables
for adolescents aged 5-19 years were used to analyse growth
indicator data and to determine impairment of growth by assessing
the relationship of the Z-score to the mean. Dietary intake data
were analysed by the principal investigator (TPG) and verified by
a registered dietician. Nutrient intakes were reported as means
and SD. Frequencies were used to determine the percentage of
subjects with nutrient intakes < 100% of the dietary reference
intakes. The Student’s t-test was performed to test the gender
difference in HAZ, WAZ and BAZ. Analysis of variance (ANOVA)
test was performed to assess the differences in mean values of
anthropometric indices by age. Correlation analysis (r) was also
conducted to evaluate the strength of the relations between
variables such as anaemia prevalence by age and gender. Poisson
regression with robust standard error analyses was conducted to
examine associations between anaemia and various covariates
of interest, such as dietary diversity and growth characteristics.
Results were reported as point estimates with 95% confidence
intervals.
Results
Population characteristics
In total n=184 children participated in this study. The children were aged 6.5 ± 0.55 years. More males participated 108/184 (58.7%) than females 76/184(41.3%). The difference in age between the boys and girls was not statistically significant. The children were all asymptomatic for anaemia, iron deficiency or any ill-health, but 5/181 (2.8%) of the children tested positive for HIV infection.Child growth
Anthropometry
The mean BMI for boys was 16.0 ± 1.40kg/m2, for girls
16.45 ± 2.06kg/m2 and overall for the study population 16.21
± 1.71kg/m2. The overall prevalence for stunting was 14/184
(7.6%), underweight 4/184 (2.1%) and wasting 2/184 (1.1%).
More boys 9/108 (8.3%) were stunted than girls 5/76 (6.6%)
Severe stunting was observed in 1/184 (0.5%) boy and stunting
in 13/184 (7.1%) of which 5/76 (6.6%) were girls and 8/108
(7.4%) boys. Underweight was observed in 2/108 (1.9%) boys
and 2/76 (2.6%) girls. Severe underweight for age was identified
in a boy 1/184 (0.5%). Wasting results showed 1/184 (0.5%)
boy who was severely wasted and 1/184 (0.5%) girl who was
wasted. Of note is that the same boy who was severely wasted
was also severely stunted and severely underweight. This child
was HIV negative, non-anaemic, body iron stores were normal,
inflammatory markers were not elevated and had no parasitic
infection detected. Conversely, 34/184 (18.5%) of these children
had a high risk of becoming overweight. 4/184 (2.2%) children
were overweight and 2/184 (1.1%) were obese - one girl and one
boy. The majority of children 87/184 (90.7%) were of normal
weight. (Table 1): Descriptive statistics for child anthropometric
indicators, n=184.

Motor skills
A low prevalence of motor impairments was noted. One
child was identified as having an abnormal gait which occurred
during both walking and running (ICF b770). Poor control and
coordination of voluntary movements (ICF b760) was identified
in 7/184 (3.8%) of the sampled population. Fine motor evaluation
showed that 7/184 (3.8%) of sampled children experienced
difficulties with fine motor hand use including the manipulation of
fingers and hands when handling small objects (ICF d4402). The
presence of anaemia was significantly associated with impaired
fine motor skills (p=0.009). An iron deficient status was also
significantly associated with impaired fine motor skills (p=0.023).
However, due to the small quantities of affected children with the
outcome variables such as gross motor development, conclusions
could not be drawn concerning the relationship between motor
development and anaemia, diet and iron deficiency as this was
inadequate for drawing statistical conclusions.
Dietary intake
Dietary diversity had a significant association with stunting
as a main effect (r=0.185, p<0.05), and was associated with less
dietary diversity using the seven day recall.
Home diet: dietary diversity and eating patterns
The children consumed mainly cereals. The consumption of
protein-rich foods both of plant and animal origin was low. Food
items such as organ meat, legumes, nuts, seeds, fish and seafood
were consumed by less than 15% of the study group. Vegetables
were consumed more frequently than fruits. The consumption of
vitamin-A rich fruits and vegetables was much lower than that of
non-vitamin-A-rich fruits and vegetables. Consumption of dark
green leafy vegetables was low although 60% of the children had
this at least once in seven days.
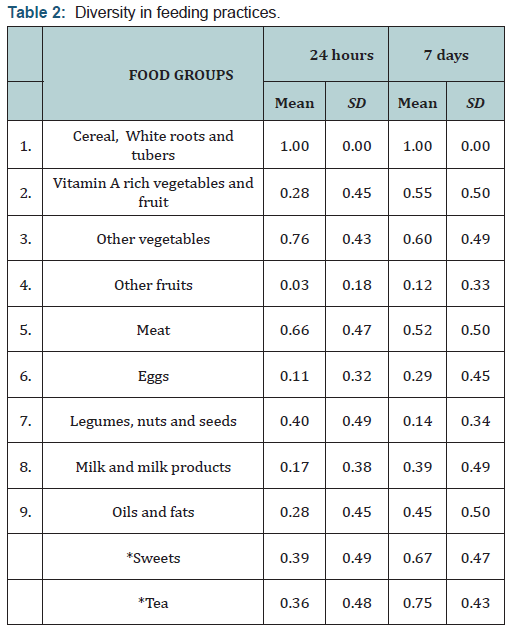
The 24-hour dietary diversity score (DDS) was generally low
with a maximum score of 7/9 food groups in 2/184 (1.1%), 95%CI
(0.3, 3.9%) and a minimum of 1/9 food groups in 2/184 (1.1%)
95% CI (0.3, 3.9%) children. The diversity scores were normally
distributed with a mean score of 3.70 (SD 1.13). Feeding patterns
for the seven-day recall were comparable to the 24-hour recall
though higher food frequency scores were documented. The range
was wider with a minimum score of 1/9 food groups consumed
for 23/184 (12.5%), 95% CI (8.5, 18.1%) and a maximum 8/9 food groups, for 7/184 (3.8%), 95% CI (1.9, 7.6%) children. A
higher mean score of 4.07 (SD 1.96) was observed over the sevenday
recall period. (Table 2): Diversity in feeding practices.
Most 91/184 (49.5%) 95% CI (42.3,56.6%) children had
a flexible meal plan and often missed meals, although 41/184
(22.3%) 95% CI (16.9, 28.8%) ate three meals plus a snack,
28/184 (15.2%) 95% CI (10.8, 21.1%) had three meals without
snacks and 12/184 (6.5%) 95% CI (3.8, 11.1%) had two meals
plus snacks. Of the children sampled 2/184 (1.1%) 95% CI (0.3,
3.9%) had gone without food for at least 24 hours in the week
preceding the interview. Most children 168/184 (91.3%) 95% CI
(86.2, 94.6%) ate the same food as that prepared for the rest of
the family. Only 94/184 (51.1%) 95% CI (43.9, 58.2%) caregivers
acknowledged that their children ate food from a school feeding
scheme. Whether or not the children ate food at the school
feeding scheme no differences were observed with stunting or the
presence of anaemia.
School meals
There were 160 children from eight schools who participated
in the school sub-survey. The schools generally selected children
to be fed in the program and did not feed all learners. The food
was served inside a classroom during break time and children
chose whether or not to come there. Serving sizes were mostly
predetermined and did not vary according to children’s needs,
age or size. A uniform serving potion was used, usually a large
dishing spoon 3/8 (37.5%) or a cup 5/8 (62.5%). The proportion consumed by the child was generally high 80-100%. Second
servings were infrequently observed 19/160 (11.9%) 95%
CI (7.7, 17.8%). The school menu guidelines were not strictly
followed though used as a guide, as some ingredients listed on
the menu were missing. The food observed was rich in cereals
and tubers (100%), non-vitamin-A-rich vegetables 7/8 (87.5%)
95% CI (52.9, 97.8%), meat 5/8 (62.5%) 95% CI (30.6, 86.3%)
as well as legumes, nuts and seeds 4/8 (50.0%) 95% CI (21.5,
78.5%). No eggs, milk or milk products were observed at the time
of the study in any of the schools. All schools assessed provided
meals during weekdays and not on weekends, school holidays or
public holidays. No take-home rations were given to children in
the observed schools.
Biochemical measurements: serum iron concentrations
The mean Hb level for this sample was 12.17 ± 1.2g/dl.
Anaemia was detected in 43/184 (23.4%) 95% CI (17.8, 30.0%)
children. The severity of anaemia was mostly mild 24/43 (55.8%)
95% CI (38.9, 67.5%) and moderate 18/43 (41.9%) 95% CI (28.4,
56.7%), only 1/43 (2.3%) 95% CI (0.4, 12.1%) child had severe
anaemia. Of the children sampled, 13/184(7.1%) 95% CI (4.2,
11.7%) had tissue iron depletion and of these 9/13 (69.2%)
95% CI (42.4, 87.3%) were anaemic. Stunting and underweight
were noted to be worse in children who were iron deficient and
anaemic but was not statistically significant (p>0.05). Table 3 -
Relationship of mean anthropometric indicators with children’s
anaemia and iron status.
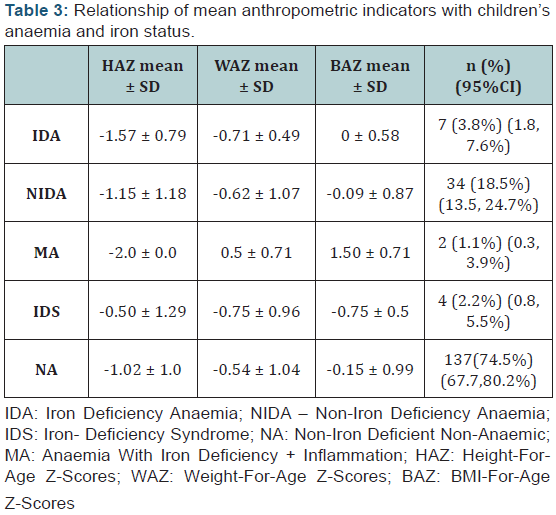
HAZ values in children with NIDA ranged widely as did
those
for non-anaemic, non-iron deficient children (Figure 1). Moreover,
the prevalence of stunting was surprisingly high among nonanaemic
non-iron deficient children (NA). Despite the trends
noted, the iron status of the children did not indicate any significant
associations with growth status. A significant relationship was
however noted between low dietary diversity from the seven day recall
and anaemia (p=0.004) Figure 1 - Distribution of height-forage
in different anaemia and iron status groups.

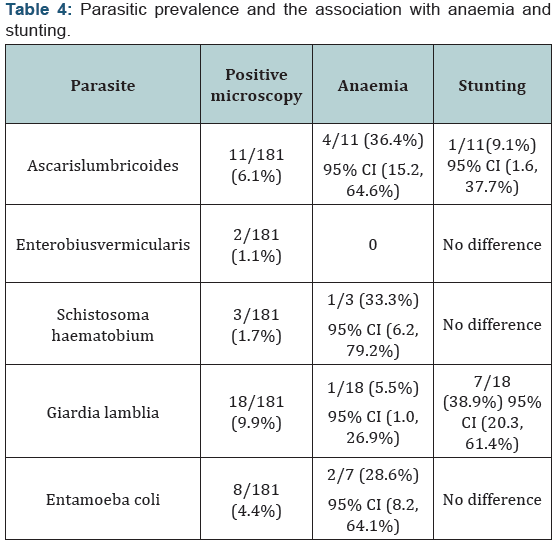
Parasitic infection
Samples of urine and stool were collected from 181/184
(98.4%) children. Positive microscopy findings were identified
in 49/181 (27.1%) 95% CI (21.1, 34.0%) of children although
pathologic infections were present in 32/181 (17.7%) 95%
CI (12.8, 23.9%). The pathologic organisms identified were
presented in (Table 1). None of the sampled children had Taenia or
Entamoeba histolyticainfection. Stunted growth was significantly
associated with parasitic infection (p=0.01) Figure 2 and anaemia
(p=0.03). Table 4- Parasitic prevalence and the association with
anaemia and stunting. Figure 2- Study profile of children with
parasite infestation and growth impairment.

Multivariate analysis - anaemia association
The presence of anaemia was significantly more likely to
be associated with iron deficiency (RRR<0.005 [0.968, 2.584])
and the presence of inflammation/infection (RRR< 0.05 [-0.04,-
0.003]) than with biological, dietary and nutrition indicators such
as worm presence (RRR>0.05 [-0.81, 0.92]), poor dietary diversity
(RRR>0.05 [-0.51, 1.02]) or growth stunting (RRR>0.05 [-1.59,
1.31]).
Discussion
This study provided supplementary evidence of a relationship
between the growth indices and anaemia, diet and iron deficiency.
The children’s growth patterns were affected by the levels
of nutritional risk in the sampled population. The children’s
growth in the presence of anaemia and iron deficiency varied
independently of the dietary diversity. The small numbers of
children identified with some of the outcome variables however
meant that conclusions on motor development could not be
drawn.
This current study identified high rates of stunting among
the sampled children. The stunting rates were similar to, though
lower than stunting rates reported in other findings for South
African children of the same age group. Anaemia was significantly
associated with low dietary diversity as well as stunting and
underweight. Dietary diversity was significantly associated with
stunting. This study did not any observe significant differences in
growth or dietary diversity for children with IDA and those with
NIDA. The motivation for this study was the high mortality globally,
attributed to under-nutrition. According to the 2013 report by
the Maternal and Child Nutrition study group, under-nutrition
accounted for 45.0% of children’s deaths which was equivalent
to more than three million deaths annually. An estimated 165
million children had stunted growth resulting in compromised
intellectual and physical development [16].
Growth indicators
Anthropometric findings from this study were compared to
outcomes from the South African National Health and Nutrition Examination Survey-one (SANHANES-1), six to nine year-old
children [3]. Anthropometric indicators for children in this
study were similar though marginally lower when compared
to the national estimates for children of the same age. Stunting
prevalence, boys (8.3%) and girls (6.6%) were lower than the
national rates of 10.0% for boys and 8.7% for girls of the same age.
Wasting (1.0%) and underweight (2.1%) were also lower than the
national prevalence of 2.4% and 9.4% respectively. For boys in this
study, the mean weight (23.6kg) and height (118.3cm) was lower
than the national mean for six to nine year old boys of 24.4kg,
123.2cm respectively. The mean BMI for boys was comparable,
being 16.0kg/m2 in this study and 15.9kg/m2 nationally. These
differences were similar to findings for girls where the mean
weight (23.2kg) and height (118.3cm) were also lower than the
national mean for six to nine year old girls of 25.4kg and 123.9cm
respectively. Girls’ mean BMI for this study was 16.45kg/m2
while the national estimate was 16.40kg/m2. The difference
between genders has been observed in other comparable studies,
reporting stunting for boys (19.1%) and girls (7.5%) [17]. Growth
impairment was more prevalent in males than females.
The trends in under-nutrition in this study are in accordance
with those observed in previous national surveys that consistently
identified stunting as the most prevalent form of under-nutrition;
followed, to a lesser extent by underweight and wasting [3,18-
21]. While it is encouraging that there is an overall decline in
stunting, our results show little difference from a 2001 study of
eight to ten year olds, also in rural KwaZulu-Natal, that reported a
7.3% prevalence of stunting [22]. Apart from infections, stunting
and under-nutrition are issues of chronic poor feeding practices
[23] and poor food accessibility [18]. This study provided insights
into both these factors through measures of dietary diversity and
eating habits.
Dietary diversity
The seven-day DDS was higher than the 24-hour DDS,
highlighting the importance of multiple assessments versus a
single day recall, in order to account for day to day variability.
Nevertheless, the mean seven-day dietary diversity was still low
(4.07 ± 1.96), although somewhat higher than that of the 1999
National Food Consumption Survey (NFCS) of children aged
one to eight years who had a mean DDS of 3.58 ± 1.37 [18]. In
the NFCS, the DDS was related to stunting, underweight and
wasting, whereas in this present study a significant association
was only identified between dietary diversity (seven-day recall)
and stunting. A similar finding was reported by an 11-country
demographic survey [24].
Dietary diversity is an indication of food accessibility,
providing a perspective on food security of the child’s household
[18]. National food surveys revealed an overall trend of improved
food security from 1999 to 2008. However, food insecurity and
hunger still prevail, with rural households being at a higher risk
[18, 25]. Recently it was shown that 17.0% of SA households have
restricted food access with a greater number (20.9%) affected in KZN [24]. Subsequently, poorer households spend more money
on staple foods, mainly maize meal and less on costly fruits and
vegetables [24]. A major concern about this population’s diet
was the low intake of fruits and vegetables (Table 2). In the
week reviewed, more than 40.0% did not consume any fruits or
vegetables. Additionally, the dietary diversity scores as well as the
school dietary data collected suggest a low dietary intake of ironrich
foods from plant and animal sources. While inaccurate recall
and underreporting are factors, it is unlikely to explain this trend.
Lack of knowledge and poor food choices, inadequate storage
facilities and far distances in rural areas are also considerations.
In some food insecure families though, as food becomes scarcer,
more dire measures are taken, such as the omitting of meals. A
2008 survey confirmed that 25.1% of children’s meals were cut,
while 16.2% of children went to bed hungry [18]. In this study
2/184 (1.1%) children had gone without food for at least 24 hours
in the preceding week.
Poor eating practices raise the risk of micronutrient
deficiencies. Promotions to encourage subsistence farming may
enable increased consumption of fruits, vegetables and animalsource
food [26,27]. This study area was rural and had very
low levels of subsistence farming [24]. In South African a staple
food fortification program has also been implemented to help
reduce the threat of micronutrient deficits in the population [28].
However, it has been argued that the continued, albeit reduced
prevalence of stunting may indicate that the food fortification
initiative has had little influence on dietary diversity [18].
The National School Nutrition Program (NSNP) is a further
public health initiative to address food insecurity and relieve
short term hunger [25]. In this study, only 51.1% of the children
ate food provided by the school feeding scheme. Encouragingly,
some researchers have shown improvements in dietary intake
and diversity [25], though there have also been some reports
of challenges at some schools [29]. Likewise, in this study, the
challenges that schools faced were mostly regarding limited food
supply and restricted availability of prescribed menu foods. Few
schools had an adequate food variety score. A previous report
also highlights that the NSNP aims to improve long term feeding
practices through nutrition education in schools [25]. This is
targeted at improving long-term dietary habits by improving food
choices and combating negative eating practices such as high
intakes of sweets and missing of meals seen in this study.
Anaemia and iron status
The results of this study show that anaemia remains a common
problem in school-aged children (23.4%). Iron deficiency was
identified in 7.1% of the sampled children and was a significant
contributor to the prevalence of anaemia. These iron status
findings were comparable to the 2012 SANHANES-1 survey
where the national prevalence for iron deficiency was 8.1% [3].
The high anaemia prevalence reported in this study was however
in contrast to the SANHANES-1 report which showed a declining
trend in anaemia (10.5%) for children aged up to 14 years. Two studies conducted in Kwazulu-Natal reported an anaemia
prevalence of 16.5% and 22.0% in school age children [30,31]. The
persistently high anaemia prevalence in this study population may
be attributed to anaemia of inflammation resulting from chronic
poorly managed infections.
Limitation
This investigation had a cross-sectional study design hence
trends over time and the temporal sequence between exposure
(anaemia, iron deficiency and dietary diversity) and outcome
(growth) could not be evaluated. Hence the cause-effect
relationship could not be determined. This cross-sectional study
measured prevalence and not incidence which could result in
prevalence-incidence bias as long-standing cases of anaemia and
dietary insufficiency may have been over-represented while shortlived
cases may be under-represented. Current exposure and
outcome were measured simultaneously; hence recent changes to
the anaemia status or dietary pattern in growth impaired children
were overlooked. The proportion of children no longer affected
by growth impairment, anaemia or iron deficiency could not be
assessed as this study did not test for evidence of past disease.
Conclusion
The overall findings from this study provide evidence of the
benefits of a diverse overall diet and suggest the improvements
required to enhance the children’s growth pattern. Interventions
providing dietary support and iron supplementation need to
be complemented with attempts to improve the general health
and nutritional status of underprivileged children. Long term
interventions and policies which target individual, community,
and national levels are needed. These may comprise providing
routine heath monitoring as well as endorsing healthy locally
obtainable wholesome food, consolidating school supplementary
feeding programs and providing behavioural modification
programs that target child care and hygiene practices relevant to
the local cultural practices and financial restrictions. Community
based prevention approaches need to be implemented together
with secondary prevention by screening and providing treatment
to children at risk. Regular, accurate measurement of growth
indicators in children and adolescents with the maintenance of
up-to-date accessible records for surveillance may be invaluable.
For more articles in Academic Journal of
Pediatrics & Neonatology please click on:
https://juniperpublishers.com/ajpn/index.php
https://juniperpublishers.com/ajpn/index.php


Comments
Post a Comment